Switch between measurement systems used on the site.
Flow:
ML/day
Volume:
Litres
Other:
Metric (km, kg, °C)
Note that you can also toggle these when you see these in the content too.
Flow calculator
From to
Misc other flow calculations can be calculated online at Kyles Converter.
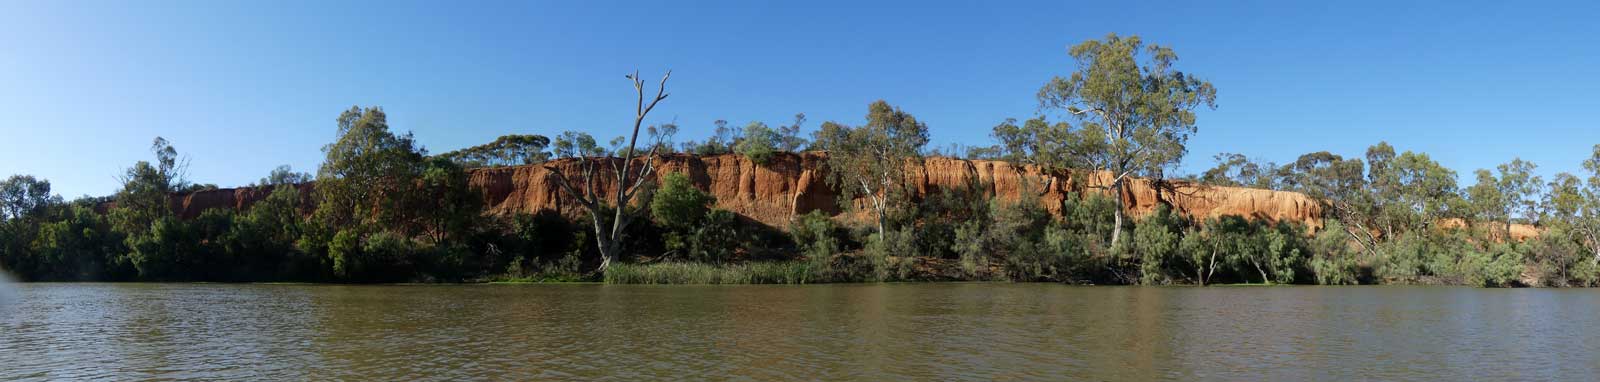
Current Flows
A look at the current flow along the river
Quick look at key river heights along the river.
Data has been automated from various sources and these have not been manually verified. The level status
is determined either from known flows before falling back to estimated flows from the BoM recorded height.
I've split the river into upper and lower sections at Burrinjuck Dam for the system overview views.
Please refer to offical sources before heading out onto the river.
Many sites lack flood height information. If the height is significantly higher than a good flow height, assume it is flooded
Level Key
No Flow
Level is at or below the known or estimated cease to flow level.
Poor Flow
Level is likely too low to paddle. Usually estimated as two cubic meters per second, (2 Cumecs, 173 ML/day or 0.8 CFS).
Low Flow
Level is likely ok to paddle but with some difficulty. Defaults level is based on two to ten cubic meters per second, (2 - 10 Cumecs, 173 - 864 ML/day, or 0.8 - 4 CFS).
Good Flow
This level is generally a great flow on larger rivers, but could be dangerous in small streams. Defaults level is above ten cubic meters per second,
(10 Cumecs, 864 ML/day, or 4 CFS). These may include flood levels if these are unknown.
Minor Flood ⚠
Low-lying areas next to water courses are inundated. Minor roads may be closed and low-level bridges submerged.
Moderate Flood ⚠
The area of inundation is more substantial. Some buildings and main traffic routes may be affected.
Major Flood ⚠
Extensive inundated. Properties and towns are likely to be isolated and major rail and traffic routes closed. Evacuation orders may be in place and the river closed to boating.
Indeterminate Flow
Not enough information is avaiable to classify the flow.
Used to indicate there is an observation but the flow could not be estimated.
Salinity
These have been given a colour coding from Good,
Fair,
Poor,
and Unpalatable.