Macquarie Marshes
A quick look at the Macquarie Marshes
A look at the flow required in key locations
")
Flow is one of the most important considerations for any trip. As a general rule, most flow appears to come from spring to early rainfalls, but rain events can occur throughout the year.
The upper gorge below Bathurst could be dangerous in high flow, however below Dubbo, a high flow is likely beneficial, and a flood event could be best for the swamp to paddle across any barbed wire fences and to ensure there is some water flowing on the other side.
The following box and whisker charts show the lowest value observed using the bottom whisker; the box is constructed with the 25%, 50% and 75% quartiles; and the top whisker marks the 90% percentile. The top 10% of records (floods) are excluded as these stretch the chart and make it unreadable.
Blue-orange box plot represents observations between Jan 1 1980 and Dec 31 1999, while the brown-yellow box-plots represent observations between Jan 1 2000 and Dec 31 2019.
Yarracoona
Downstream of Bathurst.
The primary tributaries are the Campbells and Fish Rivers
")
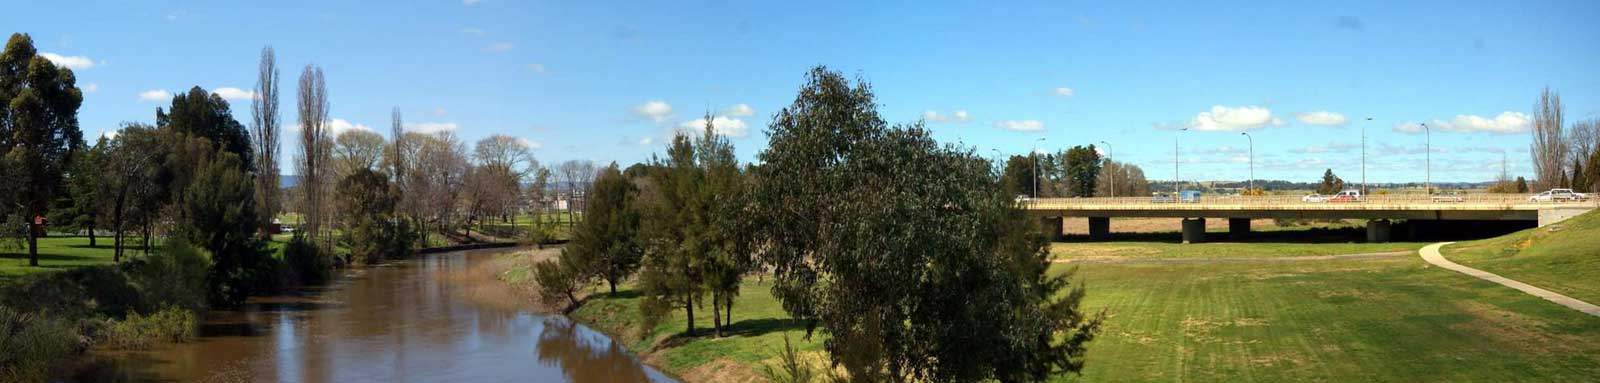
Dubbo
Burrendong Dam, upstream above Wellington, will help to regulate the flow.
Turon and Cudgegong Rivers are major tributaries above Burrendong Dam, with the Bell River confluence downstream at Wellington.
")
")
Gin Gin
Upstream of Warren Weir.
The Talbragar River is the only river of significance that feeds into the system just downstream of Dubbo.
")
")
Oxley
Between the marshes.
")
")
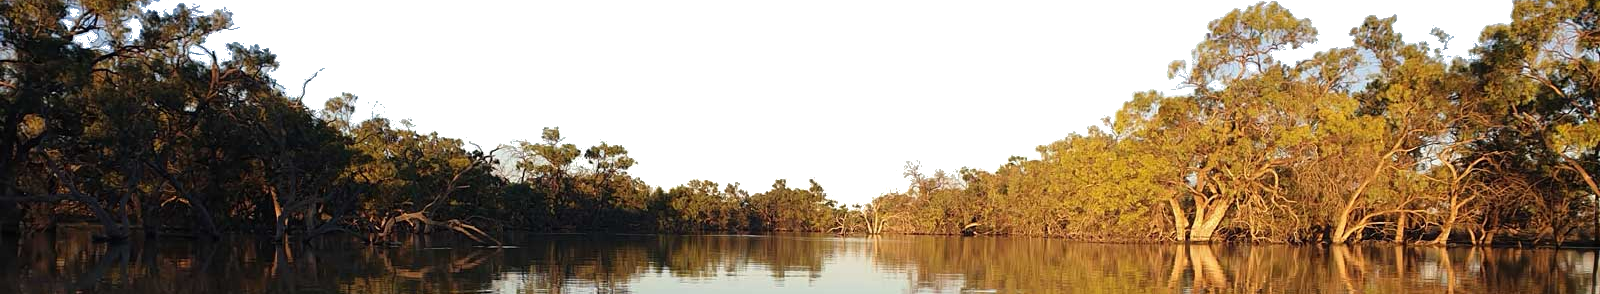
Carinda
Downstream of North Marsh.
")
")
While looking at long term averages and tends to help to indicate the best times to plan your trip, this river system is very unpredictable. The following table looks at the average flows into the Marshes over the last two decades.
Note that the channel splits and the flow reduces as you enter the marshes, so a good flow in the chart is double what is used elsewhere on the site and is set to 20 Cumecs.
Key
| Year | Monthly Median Flow at Oxley (MLD) | |||||||||||
|---|---|---|---|---|---|---|---|---|---|---|---|---|
| Jan | Feb | Mar | Apr | May | Jun | Jul | Aug | Sep | Oct | Nov | Dec | |
| 1973 | N/A | N/A | 1,576 | 623 | 708 | 450 | 2,588 | 2,791 | 2,914 | 2,939 | 3,100 | 2,524 |
| 1974 | 2,589 | 2,422 | 1,621 | 777 | 1,753 | 2,466 | 2,752 | 2,905 | 2,941 | 2,495 | 2,520 | 2,214 |
| 1975 | 1,372 | 1,547 | 975 | 896 | 485 | 468 | 475 | 590 | 671 | 2,337 | 989 | 1,290 |
| 1976 | 2,171 | N/A | N/A | N/A | 1,011 | N/A | N/A | N/A | N/A | 1,721 | 2,139 | 961 |
| 1977 | 905 | 812 | 1,180 | 544 | 708 | 967 | 660 | 495 | 646 | 538 | 699 | 390 |
| 1978 | 923 | 876 | 742 | 456 | 496 | 1,636 | 2,593 | 1,737 | 2,432 | 2,457 | 1,541 | 960 |
| 1979 | 1,181 | 731 | 1,025 | 422 | 274 | 282 | 322 | 406 | 789 | 757 | 699 | 618 |
| 1980 | 506 | 595 | 561 | 403 | N/A | N/A | N/A | N/A | N/A | N/A | N/A | N/A |
| 1981 | 121 | 176 | 103 | 126 | 68 | 65 | 367 | 1,176 | 110 | 283 | 146 | 145 |
| 1982 | 295 | 145 | 652 | 215 | 167 | 280 | 108 | 105 | 125 | 156 | 67 | 74 |
| 1983 | 271 | 180 | 99 | 53 | 180 | 798 | 138 | 293 | 1,376 | 573 | 152 | 838 |
| 1984 | 1,520 | 1,488 | 437 | 212 | 124 | 180 | 191 | 2,377 | 1,950 | 924 | 776 | 737 |
| 1985 | 930 | 570 | 567 | 149 | 115 | 137 | 59 | 417 | 294 | 1,311 | 586 | 1,446 |
| 1986 | 528 | 298 | 285 | 130 | 103 | 89 | 161 | 1,297 | 1,836 | 1,533 | 1,753 | 868 |
| 1987 | 580 | 271 | 683 | 300 | 268 | 191 | 152 | 549 | 1,660 | 568 | 312 | 500 |
| 1988 | 747 | 517 | 218 | 291 | 115 | 293 | 1,179 | 496 | 642 | 1,900 | 520 | 1,046 |
| 1989 | 1,082 | 354 | 598 | 1,579 | 2,223 | 2,574 | 2,654 | 2,685 | 1,490 | 683 | 1,566 | 360 |
| 1990 | 581 | 520 | 240 | 1,495 | 2,518 | 2,228 | 2,591 | 2,946 | 2,696 | 2,195 | 2,105 | 724 |
| 1991 | 359 | 525 | 199 | 124 | 144 | 454 | 692 | 557 | 321 | 1,201 | 109 | 603 |
| 1992 | 318 | 1,195 | 460 | 76 | 74 | 56 | 79 | 182 | 105 | 604 | 788 | 705 |
| 1993 | 1,118 | 659 | 138 | 39 | 54 | 111 | 386 | 1,234 | 1,707 | 1,948 | 1,579 | 892 |
| 1994 | 109 | 293 | 329 | 57 | 27 | 46 | 74 | 682 | 426 | 26 | 30 | 60 |
| 1995 | 1,043 | 535 | 98 | 48 | 102 | 65 | 171 | 224 | 38 | 22 | 43 | 57 |
| 1996 | 459 | 179 | 122 | 35 | 173 | 34 | 378 | 1,627 | 1,842 | 1,517 | 339 | 545 |
| 1997 | 294 | 929 | 159 | 90 | 107 | 61 | 51 | 56 | 201 | 493 | 173 | 154 |
| 1998 | 285 | 165 | 25 | 39 | 77 | 129 | 968 | 2,428 | 2,310 | 2,009 | 1,789 | 1,323 |
| 1999 | 943 | 516 | 510 | 486 | 70 | 55 | 206 | 370 | 709 | 1,469 | 1,496 | 1,517 |
| 2000 | 771 | 484 | 991 | 1,395 | 1,574 | 1,733 | 1,853 | 1,839 | 1,718 | 1,581 | 2,451 | 2,172 |
| 2001 | 1,499 | 865 | 348 | 123 | 152 | 273 | 373 | 856 | 1,315 | 564 | 144 | 191 |
| 2002 | 142 | 697 | 315 | 34 | 62 | 55 | 18 | 564 | 469 | 113 | 84 | 124 |
| 2003 | 73 | 18 | 103 | 35 | 36 | 17 | 29 | 160 | 436 | 402 | 37 | 79 |
| 2004 | 93 | 61 | 48 | 17 | 26 | 39 | 17 | 27 | 20 | 40 | 11 | 139 |
| 2005 | 18 | 37 | 21 | 32 | 34 | 27 | 51 | 4 | 15 | 31 | 1,107 | 839 |
| 2006 | 237 | 183 | 116 | 33 | 28 | 22 | 32 | 7 | 6 | 26 | 27 | 25 |
| 2007 | 44 | 26 | 15 | 3 | 0 | 322 | 39 | 4 | 7 | 0 | 10 | 179 |
| 2008 | 493 | 71 | 14 | 10 | 3 | 24 | 21 | 7 | 107 | 26 | 5 | 21 |
| 2009 | 18 | 48 | 6 | 17 | 14 | 58 | 66 | 27 | 183 | 252 | 120 | 23 |
| 2010 | 395 | 533 | 214 | 59 | 31 | 31 | 338 | 1,473 | 1,786 | 1,580 | 1,679 | 2,285 |
| 2011 | 2,275 | 1,702 | 818 | 336 | 307 | 102 | 258 | 387 | 1,119 | 1,346 | 547 | 794 |
| 2012 | 677 | 586 | 1,816 | 1,724 | 786 | 1,219 | 1,838 | 1,855 | 745 | 1,408 | 1,830 | 1,678 |
| 2013 | 448 | 174 | 293 | 66 | 21 | 101 | 496 | 545 | 653 | 627 | 53 | 115 |
| 2014 | 86 | 145 | 114 | 298 | 47 | 180 | 113 | 46 | 25 | 261 | 384 | 126 |
| 2015 | 74 | 28 | 33 | 44 | 28 | 37 | 206 | 594 | 331 | 287 | 118 | 25 |
| 2016 | 79 | 121 | 23 | 20 | 67 | 658 | 2,091 | 1,672 | 2,020 | 2,170 | 1,815 | 1,621 |
| 2017 | 1,677 | 848 | 248 | 888 | 348 | 20 | 47 | 618 | 1,037 | 720 | 320 | 158 |
| 2018 | 169 | 117 | 93 | 13 | 24 | 14 | 34 | 324 | 960 | 570 | 625 | 91 |
| 2019 | 65 | 49 | 47 | 42 | 10 | 8 | 7 | 3 | 0 | 0 | 0 | 0 |
| 2020 | 0 | 495 | 349 | 1,094 | 338 | 108 | 437 | 998 | 775 | 776 | 1,114 | 427 |
| 2021 | 502 | 171 | 443 | 685 | 119 | 484 | 1,296 | 1,111 | 1,293 | 1,445 | 1,601 | 2,176 |
| 2022 | 1,784 | 1,764 | 1,824 | 1,697 | ||||||||
©2026 Alan Davison // Credit // Disclaimer