Planning
Some additional info for anybody considering to do the Cooper Creek by kayak.
A look at the flow and management at key locations
The Cooper Creek catchment makes up a quarter of the Lake Eyre Basin, feed by mostly summer rains from Queensland, making it an intermittent river system where the main rivers dry out into a series of semi-permanent pools and permanent waterholes for much of the year.
The Windorah to Nappa Merrie section is a very wide floodplain with over 300 recognizable waterholes, many of which are permanent or semi-permanent. The water flowing in from the Thomson and Barcoo Rivers makes it one of the "wettest" reaches in the Lake Eyre Basin. Hundreds of channels form a complex maze across the floodplains that can reach up to 60 km wide, which amazingly can form a vast inland sea when in full flood. This section is classified as an anastomosing system and has more semi-permanent islands compared to a braided system that has more ephemeral sediment bars. High, but not necessarily flooding flows would be needed to ensure a flowing path through this section, with careful planning on which channel to take.
The section between Nappa Merrie to Northwest Branch – Main Branch junction flows past Innamincka and contains the Cullyamurra Waterhole. It has a depth exceeding 25 m and retains water even in severe drought conditions. This section also contains the greatest concentration of waterholes greater than 5 m depth in the entire Channel Country. The flow will almost always make it to the junction, for at least a couple of months each year. This is rather remarkable considering this is part of the driest region in the country. The waters of the channel country are forced into a relatively narrow section commonly known as the the 'Choke' at the Cullyamurra Waterhole before this opens up again with the Cooper Fan. The choke is created from the hills that form the Innamincka Dome.
Upstream flooding is usually buffered more by the time it reaches Innamincka, resulting in lower flows with a longer duration. Strzelecki Creek is a distributary at Innamincka that only flows with high flows and feeds Lakes Blanche and Callabonna. This outflow likely has a relatively low flow volume and appears to start at around 20,000 ML/day from both of the two main offtakes.
The Northwest Branch flows up to the Coongie Lakes and is the normal terminus for Cooper Creek outside of large flow years. In 2012, flows of 8,000 ML/day were split between the branches, but in 2011 with twice the flow, the Main Branch took most of the flow. Overflow from the Coongie Lakes may rejoin the Main Branch of the Cooper via poorly-defined drainages in the northwest of the Strzelecki Desert Plain.
The Main Branch down to Deparanie Waterhole requires 1,200 ML/day at Nappa Merrie before it starts flowing, but areas downstream of Embarka Swamp do not receive flow annually. The Embarka Swamp area is probably the most sensitive part of Cooper Creek to changes in flow patterns from anthropogenic causes, and the tracks to the gas/oil wells are fairly distinct on the satellite imagery.
Historically, the lower Cooper to Lake Eyre North receives flow approximately every 3-4 years but has been dry for the last decade (2012-23). The largest flow seen since 2016 was in early 2024, and it only just made it past Boggy Lake, which is before the Deparanie Waterhole that marks the end of the Cooper Fan and about 500 km short of Lake Eyre. In very wet years, there is even an opportunistic commercial fishery at Lake Hope. This usually recieves an inflow every 10 years.
Lake Appadare outflows initially outflows into Lake Hope and water will only continue down Cooper Creek once these lakes are relatively fill.
A large flood (e.g., 1973, 2010) will ensure that all of the floodplain is inundated, while a small flood (e.g., 2004) will activate most of the distributary channels and fill most of the waterholes. Outside of floods, about half of the flow seen at the Barcoo and Thomson Rivers will evaporate before reaching Innamincka.
The 2010 flood cluster only occurs every 20-40 years. The Cooper has a remarkably low gradient; downstream of the confluence of the Barcoo and Thomson Rivers, the mean gradient of the river decreases from 5.2x10⁻⁴ m/m to only 1.7x10⁻⁴ m/m from the junction to Lake Eyre North (Kotwicki, 1986) Flow from the Coongie Lakes into the Northern Overflow (via the Apanburra Channel) was likely to be insignificant.
Timing of flows from Cullyamurra to Lake Hope
Timings are calculated from the date of the peak discharge of the regional flood through Cullyamurra until flow is detected entering Lake Hope. From Costelloe (2013).
<| Flow | Total Volume (GL) | Peak Flow (ML/day) | Time taken (days) |
|---|---|---|---|
| 1989 | 4,638 | 155,000 ML/day | > 46 |
| 1990 | 9,558 | 425,000 ML/day | > 33 |
| 2000 | 3,683 | 75,000 ML/day | > 47 |
| 2010 | 7,894 | 306,000 ML/day | ~39 |
| 2011 | 3,681 | 36,000 ML/day | < 44 |
| 2012 | 821 | 9,600 ML/day | > 48 |
Embarka Swamp reach has an estimated holding capacity in the region of 100 GL, and an unknown amount in the other reaches.
For more remote areas that lack water monitoring, you can use near real-time satellite imagery to see what is happening and the historical data to see expected flow patterns in the basin.
The EO Browser from Sentinel Hub is the main tool I use for this purpose. The imagery for Coopers Creek shows how you can use this tool to track the flow.
Notice that the grey and white areas in the satellite imagery generally signify clay or salt pans that likely rarely get water (F). The black areas generally tend to suggest lignum swamps (C).
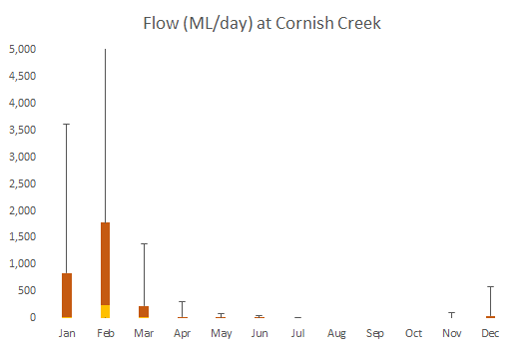
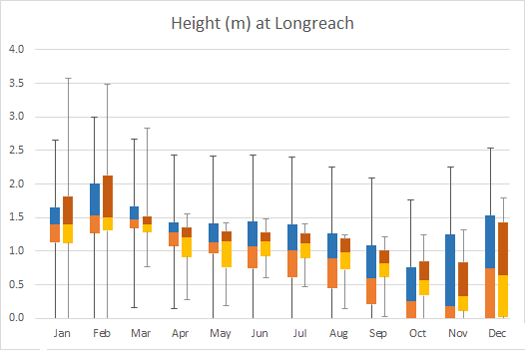
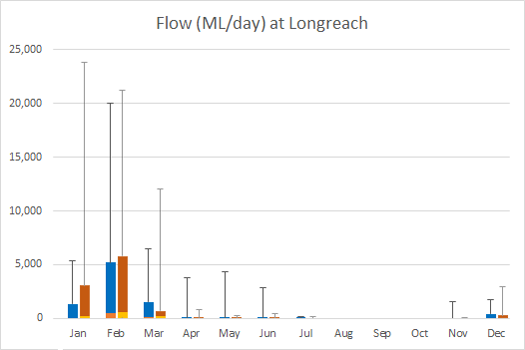
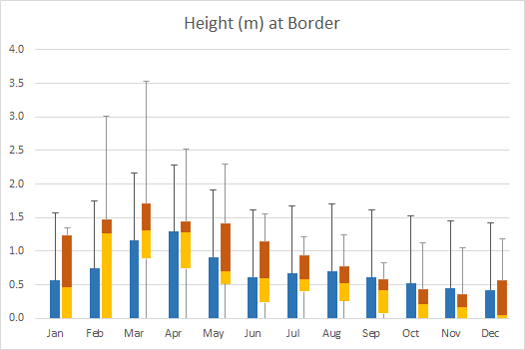
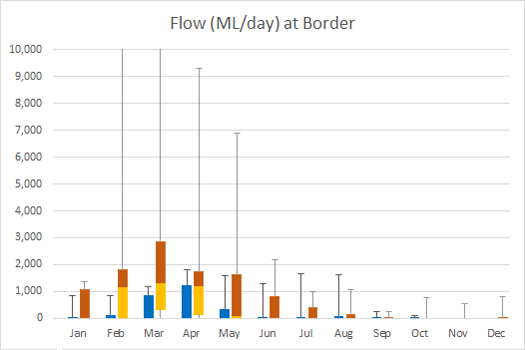
The following flow tables show the general seasonal trends across the basin.
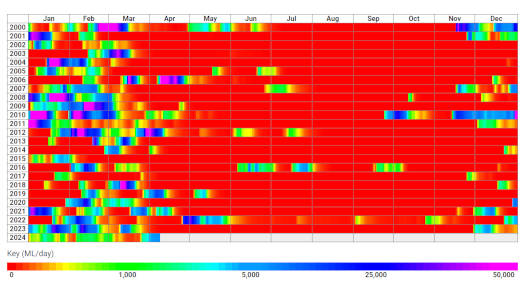
Thomson River at Longreach
HTML Version (1970-2024)
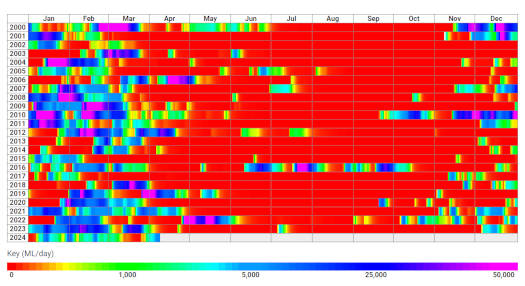
Thomson River at Stonehenge
HTML Version (2000-2024)
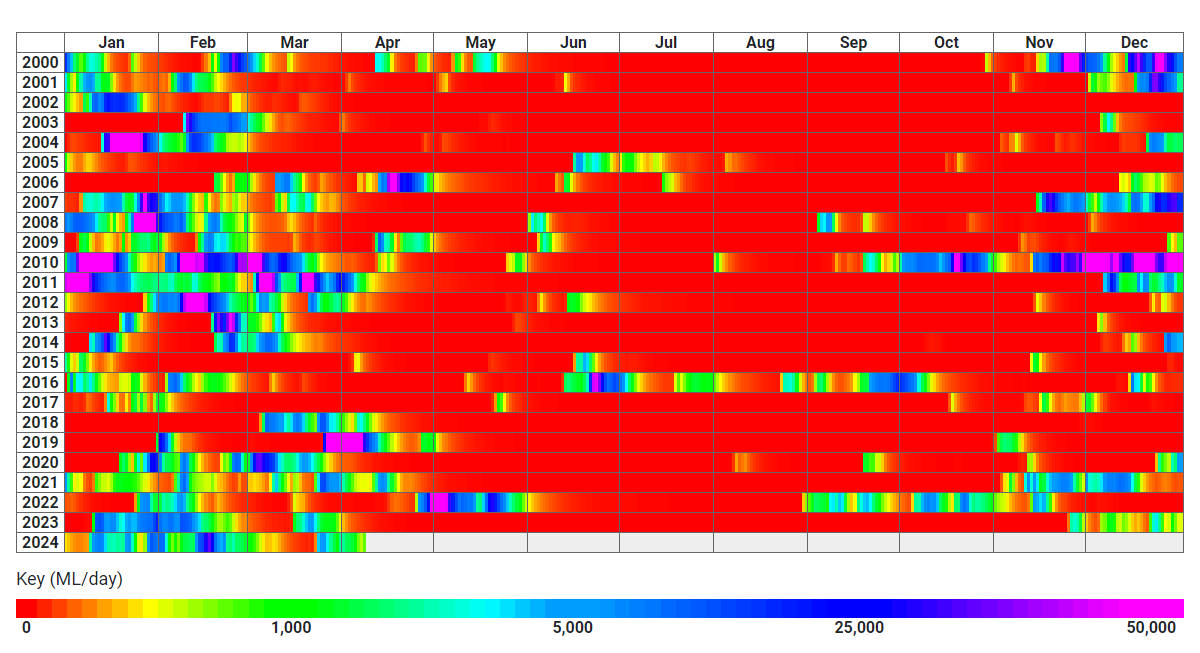
Barcoo River at Retreat
HTML Version (2000-2024)
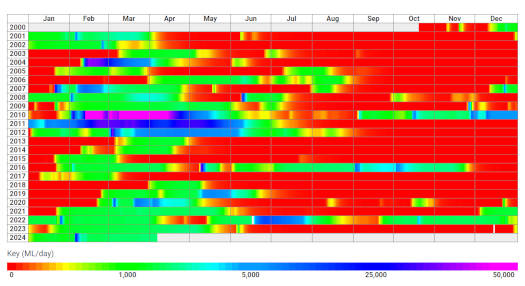
Nappa Merrie, SA-QLD border
HTML Version (1970-2024)

©2026 Alan Davison // Credit // Disclaimer