Switch between measurement systems used on the site.
Flow:
ML/day
Volume:
Litres
Other:
Metric (km, kg, °C)
Note that you can also toggle these when you see these in the content too.
Flow calculator
From to
Misc other flow calculations can be calculated online at Kyles Converter.
Basin Map & Gauges
Map of the basins and major rivers, including flow information can be found below.
Other resources for river flows can be found in many of the official sources listed below.
Minimum flow is around 2 Cumecs and a good flow is considered to be above 10 Cumecs. The latter is my personal minimum.
Flows are estimated from the BOM river feeds that give river heights only and I used historical records to correlate these heights to the historical flows.
This is only a rough estimate as water downstream can slow the flow seen at the same height as a flood that is not being held up.
Some flow heights are estimates only.
No flow
Height where flow ceased was assumed to be zero if no historical data was found.
Poor flow
A level that is likely too low to kayak, with a flow under 2 Cumecs.
Low flow
A level that may be paddlable? The flow was calculated to be under 10 Cumecs.
Good flow
A flow over 10 Cumecs. Times two is 20 Cumecs and times five is 50 Cumecs.
Flood
The river is in flood based on it's height. Only selected sites are checked.
Neutral
Location has observations but the status is unknown.
Unknown
No observation providers or no observations returned for this location.
For more remote areas that lack water monitoring, you can use near real-time satellite imagery to see what is happening and
the historical data to see expected flow patterns in the basin.
The EO Browser from Sentinel Hub is the main tool I use for this purpose. The imagery for
Coopers Creek shows how you can use this tool to track the flow.
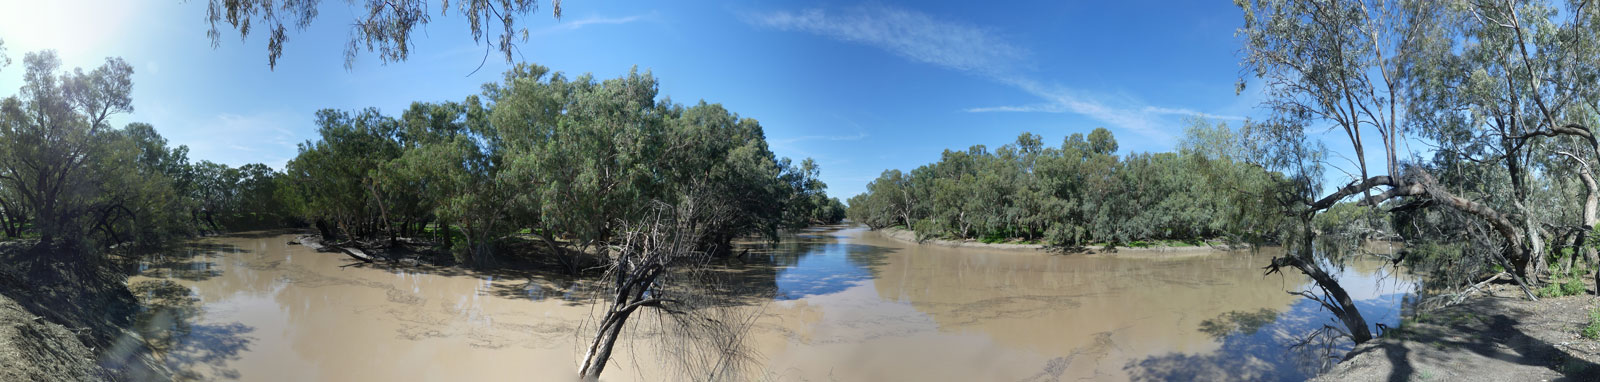
Fresh brown muddy flood waters can be traced from Windorah 2nd Dec, and down past Innamincka to the western "North-west Branch" and
the southern "Main Branch" of the Coopers Creek (A), arriving in 11th Jan.
These waters can be tracked north along the North-west Branch up towards Coongie Lakes.
These waters can be tracked west along the Main Branch until the Tirrawarra oil and gas fields in Gidgealpa on the 8th Feb. The two images show the old azure waters
from older flows being replaced by the brown flood waters in under a 7 day period.
The greener waters represent deeper waterholes that support more longer term acquatic life.
The azure waters from Boggy Lake spreading back into the Coopers Creek. The azure colouration is more typical of intermitant lakes and billabongs.
Fully dry stream bed. There is some detectable soil moisture, but even that disappears as you head downstream. No flows can be observed in the eights years
of observations of these sections.
Notice that the grey and white areas in the satellite imagery generally signify clay or salt pans that likely rarely get water (F).
The black areas generally tend to suggest lignum swamps (C).
An excellent instant view of the Murray Darling system. Includes tributaries such as the
Mitta Mitta, Ovens, Goulburn and Murrumbidgee rivers as well as others. This should be your go to resource if you are considering doing the Murray River!
This can provide an insight to what runoffs can be expected with rain. If there is a water deficit, much of any rainfall will be sucked up by the dry
soil, before feeding the creeks and streams.