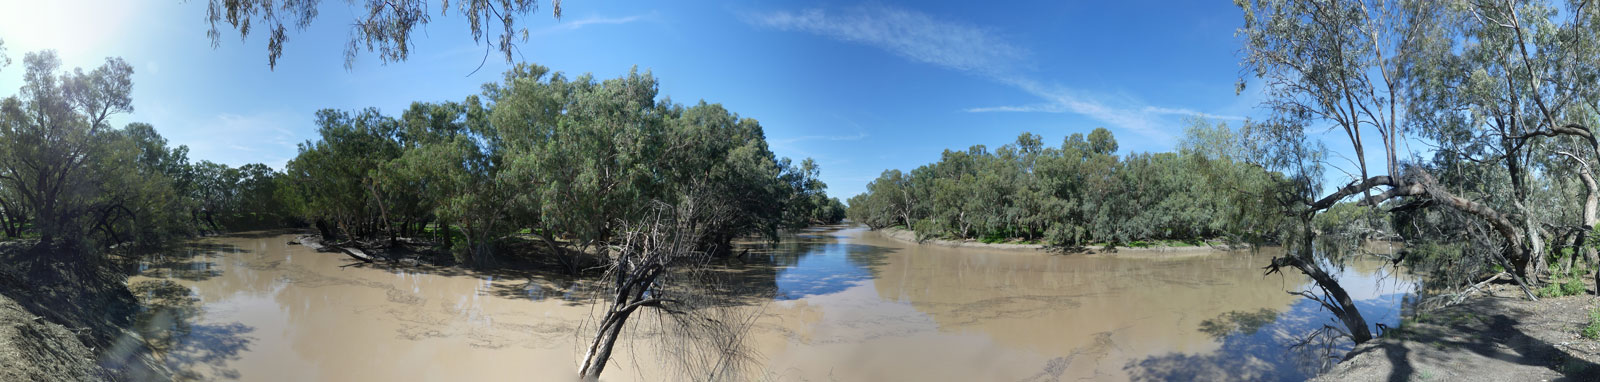
Barwon and Macintyre Rivers
Personal blog and guide to paddling the Barwon and Macintyre Rivers
A look at the flow required in key locations
Flow is one of the most important considerations for any trip. As a general rule, most high flow events are caused by either winter rainfall in northeastern NSW and summer monsoon rainfall from southern Queensland. Being on the border of the two zones, the area gets a bit of both.
Aiming for a higher flow at Goondiwindi would be preferred to avoid snags, potentially dangerous upstream.
The following box and whisker charts show the lowest value observed using the bottom whisker; the box is constructed with the 25%, 50% and 75% quartiles; and the top whisker marks the 90% percentile. The top 10% of records (floods) are excluded as these stretch the chart and make it unreadable.
Blue-orange box plot represents observations between Jan 1 1980 and Dec 31 1999, while the brown-yellow box-plots represent observations between Jan 1 2000 and Dec 31 2019.
It is interesting to note that between 1980 and 1999, the river followed the typical high winter flows from passing winter cold fronts. However the last couple of decades it has had a high summer flow that is more typical of patterns seen from the SE QLD monsonal rains. This was likely caused by East Coast Lows (ECL) that often stall off the NSW coast.
Inverell
")
")
Goondiwindi
")
")
Walgett
")
")
These are the current know gauges along the rivers along with some gauges of the major tributaries:
©2026 Alan Davison // Credit // Disclaimer